National and Virginia Alcohol-Related Crash Statistics
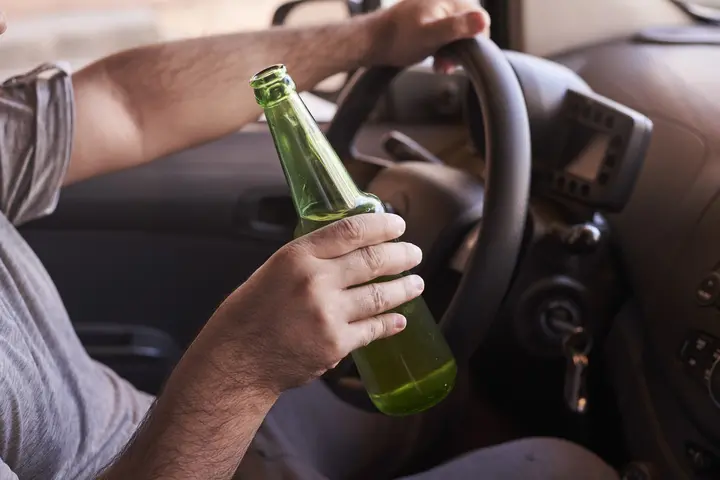
- Drunk driving is a serious problem both nationally and in Virginia. According to the National Highway Safety Institute, 13,524 people died nationally from alcohol-related car crashes in 2022.
- According to the Commonwealth of Virginia 2023 Virginia Traffic Crash Facts, there were 6,979 alcohol-related car crashes in 2023, resulting in 4,400 injuries and 293 fatalities.
- Of the 907 motor vehicle fatalities in Virginia in 2023, over 32.3% were alcohol related.
- 14,246 people were convicted of DUI in Virginia in 2023. 66.5% of DUI convictions were male, and 23.7% were female.
Hampton Roads, Virginia Alcohol-Related Crash and Injury Statistics
- In the Hampton Roads region of Virginia in 2023, there were 1,547 alcohol-related motor vehicle crashes, 1,065 alcohol-related injuries, and 59 alcohol-related fatalities.
- Using the 2023 Traffic Crash Facts data, the city and county breakdown for motor vehicle crashes in Hampton Roads was as follows:
2023 Alcohol-Related Crash Statistics
| City/County | Alcohol-Related Crashes | Alcohol- Related Injuries | Alcohol Related Fatalities |
| Chesapeake | 139 | 117 | 5 |
| Virginia Beach | 362 | 215 | 14 |
| Norfolk | 188 | 121 | 6 |
| Portsmouth | 95 | 78 | 1 |
| Suffolk | 93 | 71 | 4 |
| Hampton | 178 | 194 | 8 |
| Newport News | 193 | 114 | 5 |
| Poquoson | 12 | 7 | 0 |
| Williamsburg | 10 | 3 | 0 |
| Franklin | 2 | 2 | 0 |
| Gloucester County | 30 | 18 | 2 |
| James City County | 64 | 53 | 3 |
| York County | 45 | 16 | 4 |
| Isle of Wight County | 49 | 31 | 3 |
| Southampton County | 11 | 11 | 1 |
| Mathews County | 5 | 4 | 1 |
| Surry County | 11 | 9 | 2 |
| Total | 1,547 | 1,065 | 59 |
- Virginia Beach, by a wide margin, had the highest number of alcohol-related crashes (362), followed by Newport News (193) and Norfolk (188).
- Virginia Beach also had the highest number of alcohol-related traffic injuries (215), followed by Hampton (194) and Norfolk (121).
- Virginia Beach had the highest number of alcohol-related traffic fatalities (14), followed closely by Hampton (8) and Norfolk (6).
- Chesapeake had the 5th most alcohol-related crashes in the region (138), the 6th highest number of alcohol-related injuries (71), and was tied for 5th place for alcohol-related fatalities (3).
Alcohol-Related Crash and Injuries Changes from 2022 to 2023 in Hampton Roads
- From 2022 to 2023, the Hampton Roads region experienced a 4.42% increased in alcohol related crashes, an 11.65% increased in alcohol-related injuries, and a 15.69% increase in alcohol-related fatalities.
- Using the 2022 and 2023 Commonwealth of Virginia Traffic Crash Facts data, Hampton Roads cities and counties saw the following percent changes from 2022 to 2023:
Percent Change from 2022 to 2023
| City/County | Alcohol-Related Crashes | Alcohol- Related Injuries | Alcohol Related Fatalities |
| Chesapeake | 0.72 | 64.79 | 66.67 |
| Virginia Beach | -4.74 | 2.87 | 55.56 |
| Norfolk | 5.03 | -15.97 | -40 |
| Portsmouth | 18.75 | 47.17 | -75 |
| Suffolk | -1.06 | -15.48 | 33.33 |
| Hampton | 8.54 | 17.58 | 166.67 |
| Newport News | 4.32 | 32.56 | -28.57 |
| Poquoson | 140 | 600 | |
| Williamsburg | -44.44 | -50 | |
| Franklin | -60 | -33.33 | -100 |
| Gloucester County | 50 | 80 | 0 |
| James City County | 33.33 | 17.78 | 50 |
| York County | -2.17 | -50 | 100 |
| Isle of Wight County | 53.12 | 72.22 | 200 |
| Southampton County | -26.67 | -38.89 | -50 |
| Mathews County | -28.57 | -20 | -50 |
| Surry County | 37.5 | 200 | |
| Overall | 4.42 | 11.65 | 15.69 |
- For the cities in the Hampton Roads region, Poquoson had the highest percentage increase of alcohol-related crashes from 2022 to 2023 with a 140% increase.
- Portsmouth had the second highest increase in alcohol-related crashes (18.75%) followed by Hampton (8.54%).
- Poquoson had the highest percentage increase in alcohol-related injuries at 600%, followed by Chesapeake (64.79%) and Portsmouth (47.17%).
- Hampton had the highest percentage increase in alcohol-related fatalities at 166.67%, followed by Chesapeake (66.67%) and Virginia Beach (55.56%).
- For the counties in the Hampton Roads region, Isle of Wight had the largest percent increase of alcohol-related crashes, injuries as well as fatalities.
If you have been injured by a drunk driver in a car accident in the Hampton Roads area, contact Bordegaray Injury Law PLLC at 757-505-HURT (4878) or go to our Contact Us page to schedule a free consultation.

